1. COURSE DESCRIPTION
This course introduces students to different financial markets and their role in the economy and offers an
exploration of current developments in the world’s financial markets and institutions, including innovation,
globalization, with a focus on the actual practices of financial institutions, investors, and financial
instruments. The course also explores alternative investments techniques available in the global financial
markets including the underlying rationale for such investment types as well as providing an understanding
of the construction and management of relevant strategies. The course will provide students a general
grounding in the stock valuation approaches such as discounted cash flow models, market multiple
models as well as valuation of a young private company. The course emphasizes practical and real-world
applications of valuation methodologies and is targeted towards students interested in careers in corporate
finance, investment banking, security analysis, consulting, and private equity. The course will also introduce
students to the CFA Institute Code of Ethics and Standards of Professional Conduct and learn to describe
the sustainability landscape and analyze sustainable technologies, strategies, and business models from the
perspective of managers, entrepreneurs, and investors.
2. REASON FOR THE COURSE
The course teaches the students to be able to pull apart the financial statements to get at the relevant
information for valuation; to identify “red flags” that indicate an impending liquidity crisis; to see clearly
how industry fundamentals and competitive forces directly affect financial results and, in the process, drive
stock valuation; to determine the valuation for any public or private company whether for purchase or sale,
investment of a minority interest, going public in an IPO, or restructuring; to assess whether a company is
creating value for its shareholders; to evaluate the reports of business valuation experts and to be able to
ask the “right” questions of these experts. Students will understand what determines the value of a firm
and how to estimate that value is a prerequisite for making rational business decisions.
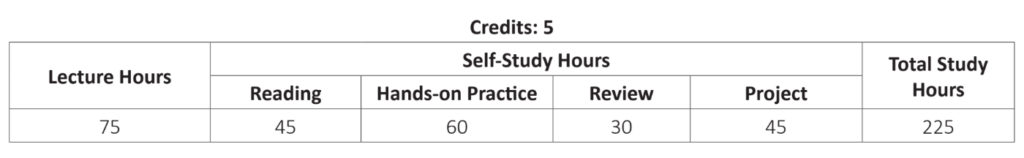
3. STUDY HOURS
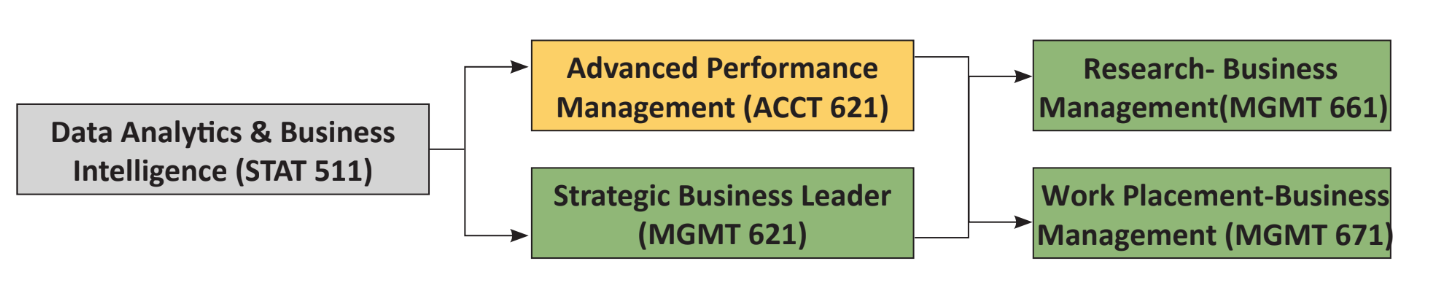
4. ROLE IN CURRICULUM
Prerequisites:
There are no prerequisites to this course other than the entrance requirements for the program.
Upon successful completion of this course students should be able to:
| Knowledge | Level of Learning | Related PLO |
|---|---|---|
| Explain the concepts in emerging technologies (CK1) Explain the concepts in emerging technologies (cloud computing, big data, data analytics, and artificial intelligence and machine learning) |
Understanding | PC5 |
| Cognitive Skills | Level of Learning | Related PLO |
| Design business metrics dashboards and reports (CC1) Design business metrics dashboards and reports to reflect business strategy and performance indicators. |
Create | PC5 |
| Communication, Information Technology, and Numerical Skills | Level of Learning | Related PLO |
| Create engaging business performance dashboards (CCIT1) Create engaging business performance dashboards using data analytics tools such as Tableau, Power Query, SQL. |
Create | PCIT1 |
| Interpersonal Skills and Responsibilities | Level of Learning | Related PLO |
| Work individually and in a team (CIP1) Work individually and in a team to support data-driven business decisions utilizing the dashboards and reports from Tableau, Power Query, SQL. |
Evaluate | PIP1 |
The learning outcomes of this course are centered into five basic areas: emerging technologies, data extraction, data transformation, reporting, and data visualization.
Grades will be determined based on a grading score, calculated using the following assessments and score allocations:
| Topic | CLO Assessment and Scoring | Skill Weighting for Grade |
|||
|---|---|---|---|---|---|
| Participation | In-class tests (3) |
Projects | Final Exam |
||
| Explain the concepts in emerging technologies (CK1) | 100 | 20% | |||
| Design business metrics dashboards and reports (CC1) | 100 | 30% | |||
| Create engaging business performance dashboards (CCIT1) | 100 | 30% | |||
| Work individually and in a team (CIP1) | 100 | 20% | |||
There will be two assignments; one is the individual project and another is the group:
Project 1 – Create Business Performance Reports using SQL
Work Arrangement: Individual
Output format : System/Tool Generated Reports (Template to be provided)
Language : English
Assignment : Students individually will create business performance reports using SQL. Data for a sample company will be provided.
Project 2 – Create Business Performance Dashboards using Tableau
Work Arrangement: Group of two to four students [No more than 4 members in the
group] Output format : System/Tool Generated Reports (Template to be provided)
Language : English
Assignment : Students, in their assignment group, will create business performance dashboards
using Tableau. Each group will need to do a presentation of their report in the class.
Data for a sample company will be provided.
This course is taught with a variety of teaching methods such as lecture, demonstration, questioning and
discussion, and significant hands-on practice. Students will be assigned readings, homeworks, projects, and
in-class tests.
The course targets the 50 lessons in the study plan below. Each lesson is 1.5 class hours each; there are a total of 75 class hours. The study plan below describes the learning outcome for each lesson, described in terms of what the student should be doing during the session and would be able to do at the end of the lesson. Readings & hands-on practice, wherever applicable, should be done by students as preparation before the start of each class. Implementation of this study plan may vary somewhat depending on the progress and needs of the students.
| Lesson | Lesson Learning Outcomes | Teaching and Learning Activities, Assessment |
|---|---|---|
| 1 | Explain Data Analytics & Business Intelligence (CK1)
|
|
| 2 | Explain Data Analytics & Business Intelligence, continued (CK1)
|
|
| 3 | Explain evolution of computing & evolving role of big data and AMIL – Part 1 (CK1)
|
|
| 4 | Explain evolution of computing & evolving role of big data and AMIL – Part 2 (CK1)
|
|
| 5 | Explain evolution of computing & evolving role of big data and AMIL – Part3 (CK1)
|
|
| 6 | Analyze data science, data analytics, and artificial intelligence relationship (CK1)
|
|
| 7 | Explain data analytics tools landscape (CK1, CC1)
Data Analysis Section |
|
| 8 | Assess data analysis tool sets (CC1, CCIT1)
|
|
| 9 | Explain data transformation and normalization (CC1, CCIT1)
|
|
| 10 | Use Power Query to transform the data (CC1, CCIT1)
|
|
| 11 | Use Power Query to extract information (CC1, CCIT1)
|
|
| 12 | Use Power Query for data consolidation & reporting (CC1, CCIT1)
|
|
| 13 | Use Power Query for debugging (CC1, CCIT1)
|
|
| 14 | Use multiple features of Power Query (CC1, CIP1)
|
|
| 15 | Create performance reports and dashboards using Power Query (CCIT1, CIP1)
|
|
| 16 | Create performance reports and dashboards using Power Query (CCIT1, CIP1)
|
|
| 17 | Quiz 1 (CK1, CC1, CCIT1) | |
| 18 | Configure SQL (Structured Query Language) (CC1, CCIT1)
|
|
| 19 | Use SQL (Structured Query Language) to write basic queries (CC1, CCIT1)
|
|
| 20 | Explain data manipulation in SQL (Structured Query Language) (CC1, CCIT1)
|
|
| 21 | Use SQL (Structured Query Language) to manipulate data (CC1, CCIT1)
|
|
| 22 | Explain database management system concepts – Part 1 (CC1, CCIT1)
|
|
| 23 | Explain database management system concepts – Part 2 (CC1, CCIT1)
|
|
| 24 | Use SQL (Structured Query Language) to create views and dynamic results (CC1, CCIT1)
|
|
| 25 | Create reports using SQL (Structured Query Language) (CC1, CCIT1)
|
|
| 26 | Use multiple features of SQL (Structured Query Language) – Part 1 (CC1, CIP1)
|
|
| 27 | Use multiple features of SQL (Structured Query Language) – Part 2 (CC1, CIP1)
|
|
| 28 | Create business performance reports using SQL (Structured Query Language) – Part 1 (CCIT1, CIP1)
|
|
| 29 | Create business performance reports using SQL (Structured Query Language) – Part 1 (CCIT1, CIP1)
|
|
| 30 | Quiz 2 (CK1, CC1, CCIT1) | |
| 31 | Explain Data Visualization (CC1, CCIT1)
|
|
| 32 | Configure Tableau (CC1, CCIT1)
|
|
| 33 | Design performance dashboard using case scenario (CC1, CCIT1)
|
|
| 34 | Use Tableau for data transformation (CC1, CCIT1)
|
|
| 35 | Use functions & tables in Tableau – Part 1 (CC1, CCIT1)
|
|
| 36 | Use functions & tables in Tableau – Part 2 (CC1, CCIT1)
|
|
| 37 | Use data visualization components in Tableau – Part 1 (CC1, CCIT1)
|
|
| 38 | Use data visualization components in Tableau – Part 2 (CC1, CCIT1)
|
|
| 39 | Use data visualization components in Tableau – Part 3 (CC1, CCIT1)
|
|
| 40 | Design business metrics dashboards in Tableau – Part 1 (CC1, CCIT1)
|
|
| 41 | Design business metrics dashboards in Tableau – Part 2 (CC1, CCIT1)
|
|
| 42 | Design business metrics dashboards in Tableau – Part 3 (CC1, CCIT1)
|
|
| 43 | Design business metrics dashboards in Tableau – Part 4 (CC1, CCIT1)
|
|
| 44 | Use multiple features of Tableau – Part 1 (CC1, CIP1)
|
|
| 45 | Use multiple features of Tableau – Part 2 (CC1, CIP1)
|
|
| 46 | Create business performance dashboards using Tableau – Part 1 (CCIT1, CIP1)
|
|
| 47 | Create business performance dashboards using Tableau – Part 2 (CCIT1, CIP1)
|
|
| 48 | Quiz 3 (CK1, CC1, CCIT1) | |
| 49 | Analyze multiple features of Power Query, SQL and Tableau (CK1, CC1, CCIT1, CIP1)
|
|
| 50 | Create performance dashboards using Power Query, SQL and Tableau (CK1, CC1, CCIT1, CIP1)
|
|
Textbooks
1. Visualization Analysis and Design (AK Peters Visualization Series) by Tamara Munzner.
References
1. Storytelling with Data: A Data Visualization Guide for Business Professionals by Cole Nussbaumer
Knaflic: Wiley.
2. M Is for (Data) Monkey: A Guide to the M Language in Excel Power Query by Ken Puls & Miguel
Escobar.
3. Collect, Combine, and Transform Data Using Power Query in Excel and Power BI (Business Skills) 1st
Edition by Gil Raviv: Pearson Education.
4. The Developer’s Guide to Azure. E-book series: Microsoft Azure.
5. The Applied SQL Data Analytics Workshop: Develop your practical skills and prepare to become a
professional data analyst, 2nd Edition by Matt Goldwasser, Upom Malik, Benjamin Johnston: Packt.
6. Visual Analytics with Tableau 1st Edition by Alexander Loth: Wiley.