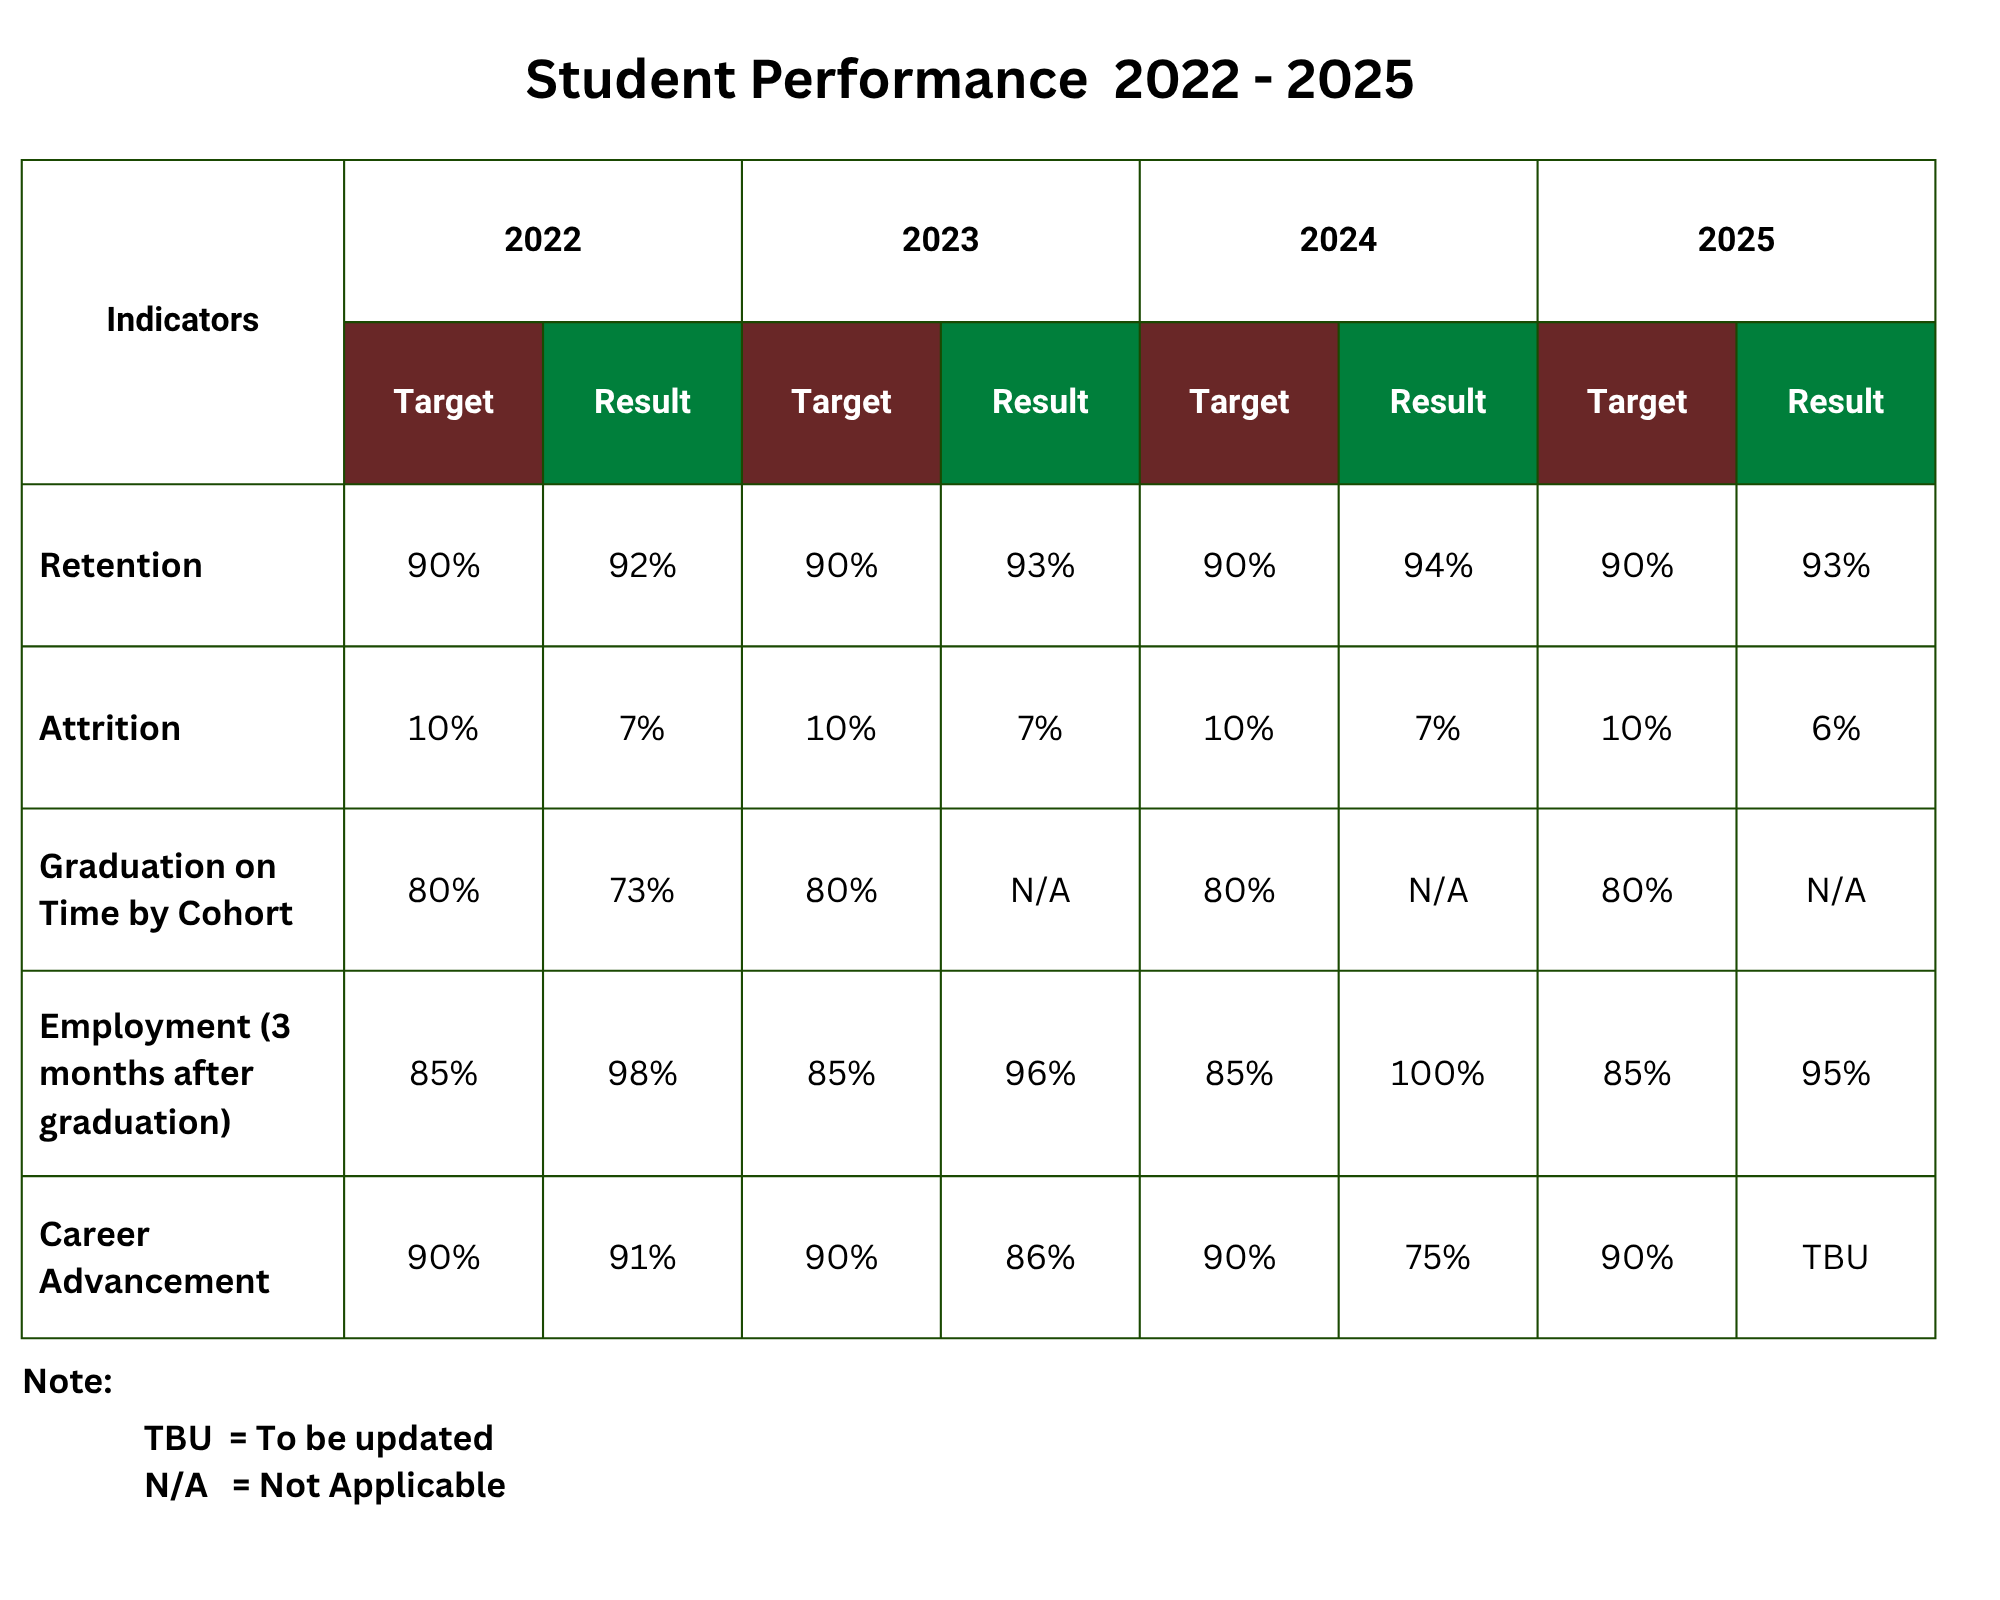
The table below shows student performance in four academic years 2022-2025. The retention rates have remained above the target of 90% every academic year. Likewise, the attrition rates have been under very good control – below 10%. In contrast, the on-time graduation rates have been consistently below the target of 80%. However, the number of graduates increased to 73% in the 2022 cohort. This trend is expected to continue to rise toward the next few years. The goals of job placement within 3 months after graduation were remarkably achieved throughout the years.
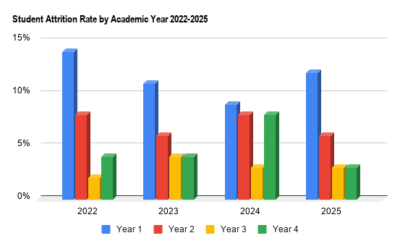
Student Attritions in AY 2022-2025
The table below demonstrates the attrition targets (10%) and the results in Academic Year 2022-2025. As can be seen in the table, the average attrition rates across all year levels generally were at 7% which are 3% lower than the targets. It should be noted that the higher the year level of study the lower the attrition rate.
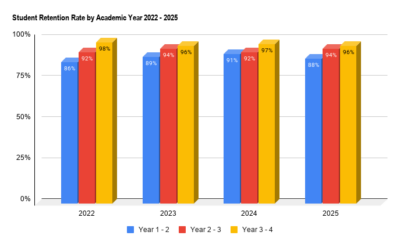
Student Retentions in AY 2022-2025
The chart below presents the retention targets and results for the academic years 2022-2025. CamEd achieved the target of 90% every academic year. On average, 92%, 93%, 94% and 93% of students were retained in academic years 2022, 2023, 2024, and 2025 respectively. In general, the retention rates in Academic Years 2024 and 2025 are higher than in earlier academic years.
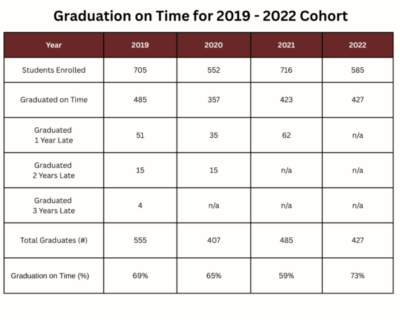
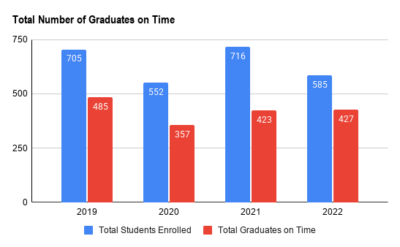
Graduations in AY 2019-2022
The table above shows the enrollment rates and graduation rates in the 2019-2022 cohorts. The graduation rates are categorized in four groups, namely graduation on time (4 years), graduating 1 year later, graduating 2 years later, and graduating 3 years later. The results illustrate an upward trend in on-time graduation rates which stood at 69% in 2019 and increased to 73% in 2022.
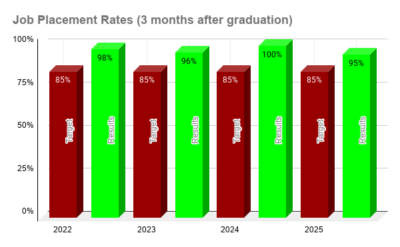
Job Placements in AY 2022-2025
The bar chart below shows the goals and results of student job placements in AY 2022-2025. The results indicate a high, stable rate of job placement in each academic year, that is 98%, 96%, 100%, and 95% in 2022, 2023, 2024, and 2025 respectively.
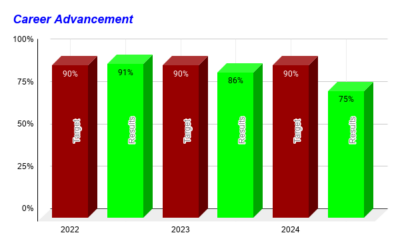
Employment Advancement in AY 2022-2025
The chart below illustrates the student employment advancement in terms of increased pay or position change within 24 months after graduation. As can be seen in the chart, 91%, 86%, and 75% of the graduates have experienced employment advancement, which is 1% higher than the target of 90% in the 2022 cohort, but 4% and 15% lower than the target in the 2023 and 2024 cohorts.