1. COURSE DESCRIPTION
The course covers the main topics in data analytics such as data extraction, transformation, reporting and visualization. The course also provides insights on how cloud computing, big data are impacting the world of data analytics and data driven decision making.
2. REASON FOR THE COURSE
Technology has become an integral part of all businesses. With the evolution of cloud computing, and reduction in computing and storage costs, businesses are relying more and more on data-driven decision making. Globalization further increases the need for all organizations to use data to make decisions. Data Analytics for Business, Accounting and Finance course enables students to have a strong foundation in data-driven decision making and become an effective business leader.
This course aims to provide students with an understanding of data analytic approaches, covering both data analysis and data visualization. This course will enable students to obtain the knowledge of data analytics, big data analytics and develop skills for data analysis and data visualization. This course has an extensive hands-on activity focus and thus students will be able to apply the knowledge and skills on real life case studies using tools such as Excel, Power Query, SQL and Tableau, and practice data driven decision making.
3. STUDY HOURS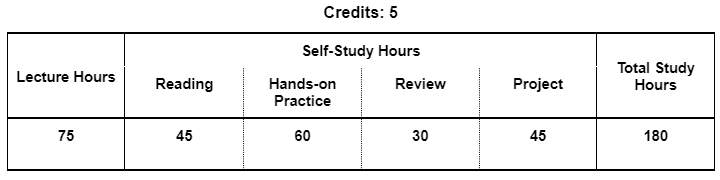
4. ROLE IN CURRICULUM
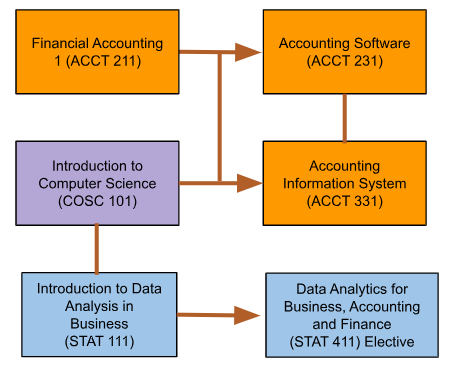
Prerequisites:
Students must have completed Introduction to Data Analysis in Business (STAT 111).
On successful completion of this course students should be able to:
| Knowledge | Level of Learning |
Related PLO |
|---|---|---|
| Explain Emerging Technologies Concepts (CK1) Explain the concepts in emerging technologies (cloud computing, big data, data analytics, and artificial intelligence and machine learning) |
Understand | PCIT1 |
| Cognitive Skills | Level of Learning |
Related PLO |
|
Design Business Dashboards, Reports, and Performance (CC1) |
Create | PK2 |
| Communication, Information Technology, and Numerical Skills | Level of Learning |
Related PLO |
| Create Business Performance Dashboards (CCIT1) Create engaging business performance dashboards using data analytics tools such as Tableau, Power Query, SQL. |
Create | PCIT1 |
| Interpersonal Skills and Responsibilities | Level of Learning |
Related PLO |
| Work individually and in a team (CIPI) Work individually and in a team to support data-driven business decisions utilizing the dashboards and reports from Tableau, Power Query, SQL |
Characterize | PIP1 |
Grades will be determined based on the following assessments and score allocations:
| SKILL | Assessment | Skill Weighting for Grade | ||||
|---|---|---|---|---|---|---|
| Participation | In-class test | Project | Final Exam | |||
| Explain Emerging Technologies Concepts (CK1) | 100% | 10% | ||||
| Design Business Dashboards, Reports, and Performance (CC1) | 50% | 50% | 30% | |||
| Create Business Performance Dashboards (CCIT1) | 100% | 50% | ||||
| Work both in team and individually to assist data-driven in Business Decision (CIPI) |
100% | 10% | ||||
This course is taught with a variety of teaching methods such as lecture, demonstration, questioning and discussion, and significant hands-on practice. Students will be assigned readings, homeworks, projects, and in-class tests.
There will be two assignments; one is the individual project and another is the group
| Assignment 1: |
Create Business Performance Reports using SQL |
| Work Group: | Individual |
| Output format: | System/Tool Generated Reports (Template to be provided) |
| Language: | English |
|
Description: |
Students individually will create business performance reports using SQL. Data for a sample company will be provided. Assignment Rubric. |
|
Assignment 2: |
Create Business Performance Dashboards using Tableau |
| Work Group: | Group of two to four students [No more than 4 members in the group] |
| Output format: | System/Tool Generated Reports (Template to be provided) |
| Language: | English |
|
Description: |
Students, in their assignment group, will create business performance dashboards using Tableau. Each group will need to do a presentation of their report in the class. Data for a sample company will be provided. Assignment Rubric. |
The course targets the 50 lessons in the study plan below. Each lesson is 1.5 class hours each; there are a total of 75 class hours. The study plan below describes the learning outcome for each lesson, described in terms of what the student should be doing during the session and would be able to do at the end of the lesson. Readings & hands-on practice, wherever applicable, should be done by students as preparation before the start of each class. Implementation of this study plan may vary somewhat depending on the progress and needs of the students.
| Lesson Learning Outcomes | Teaching and Learning Activities, Assessment | |
|---|---|---|
| 1 |
Data Analytics & Business Intelligence
|
Lecture (T) Group Discussion (T,A) |
| 2 |
Explain Data Analytics & Business Intelligence, continued (CK1)
|
Lecture (T) Group Discussion (T,A) |
| 3 |
Explain evolution of computing & evolving role of big data and AMIL – Part 1 (CK1)
|
Lecture (T) Group Discussion (T,A) |
| 4 |
Explain evolution of computing & evolving role of big data and AMIL – Part 2 (CK1) Big Data – The changing paradigm
|
Lecture (T) |
| 5 |
Explain evolution of computing & evolving role of big data and AMIL – Part3 (CK1) Artificial intelligence & machine learning (AIML)
|
Lecture (T) Group Discussion (T,A) |
| 6 |
Analyze data science, data analytics, and artificial intelligence relationship (CK1)
|
Lecture (T) Group Discussion (T,A) |
| 7 |
Explain data analytics tools landscape (CK1, CC1)
|
Lecture (T) Group Discussion (T,A) |
| Data Analysis Section | ||
| 8 |
Assess data analysis toolset (CC1, CCIT1)
|
Lecture (T) |
| 9 |
Explain data transformation and normalization (CC1, CCIT1)
|
Lecture (T) Discussion (T,A) Hands-on practice (A) |
| 10 |
Use Power Query to transform the data (CC1, CCIT1) Data transformation hands-on |
Lecture (T) Discussion (T,A) Hands-on practice (A) |
| 11 |
Use Power Query to extract information (CC1, CCIT1)
|
Lecture (T) Discussion (T,A) Hands-on practice (A) |
| 12 |
Use Power Query for data consolidation & reporting (CC1, CCIT1)
|
Lecture (T) Discussion (T,A) Hands-on practice (A) |
| 13 |
Use Power Query for debugging (CC1, CCIT1)
|
Lecture (T) Discussion (T,A) Hands-on practice (A) |
| 14 |
Use multiple features of Power Query (CC1, CIP1) Recap Power Query |
Lecture (T) Group Discussion (T,A) |
| 15 |
Create performance reports and dashboards using Power Query (CCIT1, CIP1) Practice Session with Learning Assessment |
Hands-On Activity (A) |
| 16 |
Create performance reports and dashboards using Power Query (CCIT1, CIP1) Practice Session with Learning Assessment, continued |
Hands-On Activity (A) |
| 17 | Quiz 1 (CK1, CC1, CCIT1) | |
| 18 |
Configure SQL (Structured Query Language) (CC1, CCIT1)
|
Lecture (T) Discussion (T,A) Hands-on practice (A) |
| 19 |
Use SQL (Structured Query Language) to write basic queries (CC1, CCIT1) Writing SQL queries hands-on |
Lecture (T) Discussion (T,A) Hands-on practice (A) |
| 20 |
Explain data manipulation in SQL (Structured Query Language) (CC1, CCIT1)
|
Lecture (T) Discussion (T,A) Hands-on practice (A) |
| 21 |
Use SQL (Structured Query Language) to manipulate data (CC1, CCIT1) Data manipulation hands-on |
Lecture (T) Discussion (T,A) Hands-on practice (A) |
| 22 |
Explain database management system concepts – Part 1 (CC1, CCIT1)
|
Lecture (T) Group Discussion (T,A) |
| 23 |
Explain database management system concepts – Part 2 (CC1, CCIT1)
|
Lecture (T) Discussion (T,A) Hands-on practice (A) |
| 24 |
Use SQL (Structured Query Language) to create views and dynamic results (CC1, CCIT1)
|
Lecture (T) |
| 25 |
Create reports using SQL (Structured Query Language) (CC1, CCIT1)
|
Lecture (T) Discussion (T,A) Hands-on practice (A) |
| 26 |
Use multiple features of SQL (Structured Query Language) – Part 1 (CC1, CIP1) Recap SQL 1 |
Lecture (T) Discussion (T,A) |
| 27 |
Use multiple features of SQL (Structured Query Language) – Part 2 (CC1, CIP1) Recap SQL 2 |
Lecture (T) Discussion (T,A) |
| 28 |
Create business performance reports using SQL (Structured Query Language) – Part 1 (CCIT1, CIP1) Practice Session with Learning Assessment |
Hands-on practice (A) |
| 29 |
Create business performance reports using SQL (Structured Query Language) – Part 1 (CCIT1, CIP1) Practice Session with Learning Assessment, continued |
Hands-on practice (A) |
| 30 | Quiz 2 (CK1, CC1, CCIT1) | |
| Data Visualization | ||
| 31 |
Explain Data Visualization (CC1, CCIT1)
|
Lecture (T) Group Discussion (T,A) |
| 32 |
Configure Tableau (CC1, CCIT1)
|
Lecture (T) Discussion (T,A) Hands-on practice (A) |
| 33 |
Design performance dashboard using case scenario (CC1, CCIT1)
|
Lecture (T) Discussion (T,A) Hands-on practice (A) |
| 34 |
Use Tableau for data transformation (CC1, CCIT1)
|
Lecture (T) Discussion (T,A) Hands-on practice (A) |
| 35 |
Use functions & tables in Tableau – Part 1 (CC1, CCIT1)
|
Lecture (T) Discussion (T,A) Hands-on practice (A) |
| 36 |
Use functions & tables in Tableau – Part 2 (CC1, CCIT1)
|
Lecture (T) |
| 37 |
Use data visualization components in Tableau – Part 1 (CC1, CCIT1)
|
Lecture (T) Discussion (T,A) Hands-on practice (A) |
| 38 |
Use data visualization components in Tableau – Part 2 (CC1, CCIT1)
|
Lecture (T) Discussion (T,A) Hands-on practice (A) |
| 39 |
Use data visualization components in Tableau – Part 3 (CC1, CCIT1)
|
Lecture (T) Discussion (T,A) Hands-on practice (A) |
| 40 |
Design business metrics dashboards in Tableau – Part 1(CC1, CCIT1) Creating Visuals Activity – Hands-on |
Hands-on Activity (A) |
| 41 |
Design business metrics dashboards in Tableau – Part 2 (CC1, CCIT1)
|
Lecture (T) |
| 42 |
Design business metrics dashboards in Tableau – Part 3 (CC1, CCIT1)
|
Lecture (T) Discussion (T,A) |
| 43 |
Design business metrics dashboards in Tableau – Part 4 (CC1, CCIT1)
|
Lecture (T) Discussion (T,A) |
| 44 |
Use multiple features of Tableau – Part 1 (CC1, CIP1) Recap 1 |
Lecture (T) Discussion (T,A) |
| 45 |
Use multiple features of Tableau – Part 2 (CC1, CIP1) Recap 2 |
Lecture (T) Discussion (T,A) |
| 46 |
Create business performance dashboards using Tableau – Part 1 (CCIT1, CIP1) Practice Session with Learning Assessment |
Hands-on Activity (A) |
| 47 |
Create business performance dashboards using Tableau – Part 2 (CCIT1, CIP1) Practice Session with Learning Assessment, continued |
Hands-on Activity (A) |
| 48 | Quiz 3 (CK1, CC1, CCIT1) | |
| 49 |
Analyze multiple features of Power Query, SQL and Tableau (CK1, CC1, CCIT1, CIP1) Overall Recap Session 1 |
Lecture (T) |
| 50 |
Create performance dashboards using Power Query, SQL and Tableau (CK1, CC1, CCIT1, CIP1) Overall Recap Session 2 |
Lecture (T) Discussion (T,A) |
Textbooks
References