1. COURSE DESCRIPTION
This course introduces the basic concepts and techniques of statistics, which is the study of how to collect, organize, summarize, present, and draw conclusions from data. Statistics is essential for many fields and applications that involve data analysis and interpretation. In this course, you will learn the fundamental principles and methods of statistics, such as descriptive statistics, estimation, hypothesis testing, and regression.
2. REASON FOR THE COURSE
This course can provide valuable skills and knowledge for students who are majoring in accounting and finance. Statistics can help them analyze data, interpret results, and make decisions based on empirical evidence. Statistics can also help them understand the concepts and methods of and assist them in carrying out their tasks of auditing, financial reporting, and risk management. A statistics course can enhance their critical thinking, problem-solving, and communication abilities, which are essential for their future careers. Therefore, taking a statistics course is a worthwhile investment for accounting and finance majors.
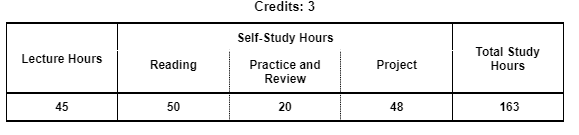
3. STUDY HOURS
4. ROLE IN CURRICULUM
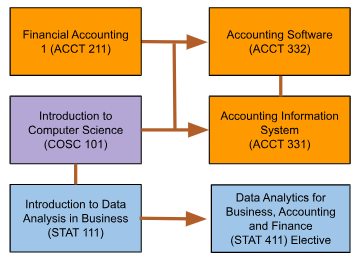
Prerequisites:
There is no prerequisite for Introduction to Data Analysis in Business (STAT 111). However, to take this course students must have a strong foundation in algebra and be able to use a spreadsheet program, particularly Excel and Google Sheets.
On successful completion of this course, students will be able to:
| Knowledge | Level of Learning |
Related PLO |
|---|---|---|
| Describe statistical methods (CK1) Describe the methods for organizing, summarizing, interpreting, and drawing conclusions from business-related data |
Understand | PCIT1 |
| Cognitive Skills | Level of Learning |
Related PLO |
| Apply statistical methods (CC1) Apply statistical methods to solve real-world business problems. |
Apply | PCIT1 |
| Write statistical analysis reports (CC2) Write reports of the statistical analysis results. |
Create | PCIT1 |
| Communication, Information Technology, and Numerical Skills | Level of Learning |
Related PLO |
| Explain statistical results (CCIT1) Explain statistical results to both technical and non-technical audiences. |
Apply | PCIT2 |
| Use spreadsheet software (CCIT2) Use spreadsheets such as Microsoft Excel/Google Sheets to analyze data. |
Apply | PCIT2 |
| Interpersonal Skills and Responsibilities | Level of Learning |
Related PLO |
| Use statistics ethically (CIP1) Use statistics in an ethical and responsible way, in order to avoid misleading data and interpretation. |
Apply |
PCIT2 |
Grades will be determined based on a grading score, calculated using the following assessments and score allocations:
| SKILL | Assessment | Skill Weighting for Grade | ||||
|---|---|---|---|---|---|---|
| Participation | Quiz | Project | final case study | |||
| Describe statistical methods (CK1) | 60% | 40% | 10% | |||
| Apply statistical methods (CC1) | 60% | 40% | 20% | |||
| Write statistical analysis reports (CC2) | 60% | 40% | 30% | |||
| Explain statistical results (CCIT1) | 100% | 10% | ||||
| Use spreadsheet software (CCIT2) | 70% | 30% | 20% | |||
| Use statistics ethically (CIP1) | 100% | 10% | ||||
This course utilizes a variety of teaching methods, including lectures, demonstrations, questioning, and problem-solving discussions. Additionally, gamification tools such as Quiz or Kahoot are integrated into the class. Students will be assigned readings, homework, projects, and quizzes.
During the course, there is one project assignment:
| Assignment: | Data Analysis for Business Research Project |
| Work Group: | Group of 3-5 students |
| Output Format | APA Format Report |
| Language: | English |
| Description: | Each team selects a relevant topic related to service, product, pricing, or a similar aspect. They create a survey to collect data, then use statistical data analysis skills to interpret, summarize, and draw conclusions. Finally, they present their findings in an APA-formatted report. |
The course targets the 30 lessons in the study plan below. Each lesson is 1.5 class hours; there are a total of 45 class hours. The study plan below describes the skills to be learned in each lesson. Readings should be completed before the start of each class. Implementation of this study plan may vary depending on the progress and needs of students. References are supporting documents that students may optionally read for deeper understanding or clarification.
| No | Lesson Learning Outcomes | Teaching (T), and Assessment (A) Methods |
|---|---|---|
| 1 | Introduction to the course and overview of the course and requirements. | Lecture (T) Discussion (A) |
| 2 |
Fundamental statistical terms
|
Lecture (T) Demonstration (T) Discussion (T, A) Quizizz/Kahoot (T, A) Reading: (Bluman, 2023, pp.2-11) |
| 3 |
Sampling Techniques
|
Lecture (T) Demonstration (T) Questioning (T, A) Reading: (Bluman, 2023, pp.11-17) |
| 4 |
Organizing Data
|
Lecture (T) Demonstration (T) Questioning (T, A) Reading: (Bluman, 2023, pp.42-53) |
| 5 |
Organizing and presenting data
|
Lecture (T) Demonstration (T) Questioning (T, A) Quizizz/Kahoot (T, A) Reading: (Bluman, 2023, pp.59, 76-86) |
| 6 |
Measures of Central Tendency
|
Lecture (T) Demonstration (T) Questioning (T, A)Reading: (Bluman, 2023, pp.113-123) |
| 7 |
Measures of Variation
|
Lecture (T) Demonstration (T) Questioning (T, A)Reading: (Bluman, 2023, pp.131-140) |
| 8 |
Measures of Position
|
Lecture (T) Demonstration (T) Questioning (T, A)Reading: (Bluman, 2023, pp.131-140) |
| 9 |
A review of descriptive statistics
|
Discussion (T, A) Quizizz Game/Kahoot (T, A) |
| 10 |
Quiz 1
|
Quiz (A) |
| 11 |
Estimate the mean
|
Lecture (T) Demonstration (T) Questioning (T, A)Reading: (Bluman, 2023, pp. 370-382) |
| 12 |
Estimate the mean
|
Lecture (T) Demonstration (T) Questioning (T, A)Reading: (Bluman, 2023, pp. 383-389) |
| 13 |
Estimate the proportion
|
Lecture (T) Demonstration (T) Questioning (T, A)Reading: (Bluman, 2023, pp. 389-397) |
| 14 |
Estimate the variance and standard deviation
|
Lecture (T) Demonstration (T) Group problem-solving (T, A) Quizizz/Kahoot (T, A)Reading: (Bluman, 2023, pp. 404-412) |
| 15 |
A review of parameter estimation
|
Presenting(T) Group problem-solving (T, A)Quizizz/Kahoot (T, A) |
| 16 |
Statistical hypothesis test
|
Lecture (T) Demonstration (T) Questioning (T, A) Quizizz/Kahoot (T, A) Reading: (Bluman, 2023, pp. 414-427) |
| 17 |
One Sample Z test for the mean
|
Lecture (T) Demonstration (T) Questioning (T, A) Group problem-solving (T, A)Reading: (Bluman, 2023, pp. 428-441) |
| 18 |
The difference between two means
|
Lecture (T) Demonstration (T) Questioning (T, A) Group problem-solving (T, A)Reading: (Bluman, 2023, pp. 490-501) |
| 19 |
One Sample t-test and independent sample t-test
|
Lecture (T) Demonstration (T) Questioning (T, A) Group problem-solving (T, A)Reading: (Bluman, 2023, pp. 503-505, 507-510) |
| 20 |
Independent sample t-test and paired sample t-test
|
Lecture (T) Demonstration (T) Questioning (T, A) Group problem-solving (T, A)Reading: (Bluman, 2023, pp.509, 511-522) |
| 21 |
Z test for the proportion(s)
|
Lecture (T) Demonstration (T) Questioning (T, A) Group problem-solving (T, A)Reading: (Bluman, 2023, pp. 453-461, 523-531) |
| 22 |
Difference between two variances
|
Lecture (T) Demonstration (T) Questioning (T, A) Group problem-solving (T, A)Reading: (Bluman, 2023, pp. 462-474, 523-531) |
| 23 |
Non-Parametric Test
|
Lecture (T) Demonstration (T) Questioning (T, A) Group problem-solving (T, A)Reading: (Bluman, 2023, pp.613-645) |
| 24 |
A review of hypothesis test
|
Presenting(T) Group problem-solving (T, A) Quizizz/Kahoot (T, A) |
| 25 |
Scatter Plot and Correlation Analysis
|
Lecture (T) Demonstration (T) Questioning (T, A) Group problem-solving (T, A)Reading: (Bluman, 2023, pp.551-567) |
| 26 |
Least Square Method
|
Lecture (T) Demonstration (T) Questioning (T, A) Group problem-solving (T, A)Reading: (Bluman, 2023, pp.551-567) |
| 27 |
Confidence Interval and Prediction Interval
|
Lecture (T) Demonstration (T) Questioning (T, A) Group problem-solving (T, A)Reading: (Bluman, 2023, pp.551-567) |
| 28 |
A Review of correlation and simple linear regression
|
Presenting(T) Group problem-solving (T, A) Quizizz/Kahoot (T, A) |
| 29 |
Quiz 2
|
Quiz (A) |
| 30 | Overall review for final exam | Presenting(T) Group problem-solving (T, A) Quizizz/Kahoot (T, A) |
Textbooks
Bluman, A. G. (2023). Elementary Statistics: A Step by Step Approach. New York: McGraw Hill Education
References
Lind, D. A., Marchal, W. G., and Wathen, M. (2021). Statistical Techniques in Business and Economics. New York: New York: McGraw Hill Education